exploring the correlation between trees and inequality in philadelphia
“Money may not grow on trees, but....in a way, trees grow on money” --Schwarz, et al. “Trees Grow On Money: Urban Tree Canopy Cover and Environmental Justice”
INTRODUCTION
Extensive research has already been done on the environmental, economical and aesthetic benefits of trees. The presence of trees in urban areas helps with carbon sequestration and the reduction of other air pollutants. Trees help mitigate the urban heat island effect and their cooling conserves energy, which reduces energy bills for residents. They certainly add value to surrounding businesses, homes, and tax base. Trees are also used in urban planning as a way to reduce urban traffic speeds and improve safety. Some studies have demonstrated that the presence of trees can have a positive impact on overall emotional and psychological health, and have argued that greater tree presence can reduce road rage [1]. Despite these extensive benefits, a rising concern is the socio-spatial inequity associated with the distribution of greenery. Increasingly tree coverage is becoming understood as a kind of proxy for income, race, and public investment. Thus, a tree is much more than a public good; ultimately, it is an investment that reveals a lot about the social and economic capital of a neighborhood. Past studies based in Baltimore, Los Angeles, New York, Philadelphia, Raleigh, Sacramento and Washington, D.C. have shown a strong correlation between tree scarcity and social-economic disparity. In other words, neighborhoods of lower income tend to have less trees. I selected Philadelphia as a case study for my project because of its historic demographic changes and recent efforts to become the “City of Arborly Love.”
Demographic changes in Philadelphia, as reported by the Philadelphia Research Institute concluded, “Philadelphia has experienced significant changes in its ethnic and racial composition over the last two decades, with many neighborhoods undergoing sweeping transformations.”[2] The study, which analyzes neighborhood change using census data, found that between 1990 and 2010, the white Population in Philadelphia fell by nearly a third and the black population became more dispersed into various neighborhoods throughout the city – particularly Northeast Philadelphia. The map in Figure 1 shows how black population percentages in each census tract have become more dispersed in neighborhoods in Philadelphia. Both the Hispanic and Asian populations more than doubled, and have also become more dispersed throughout the city.
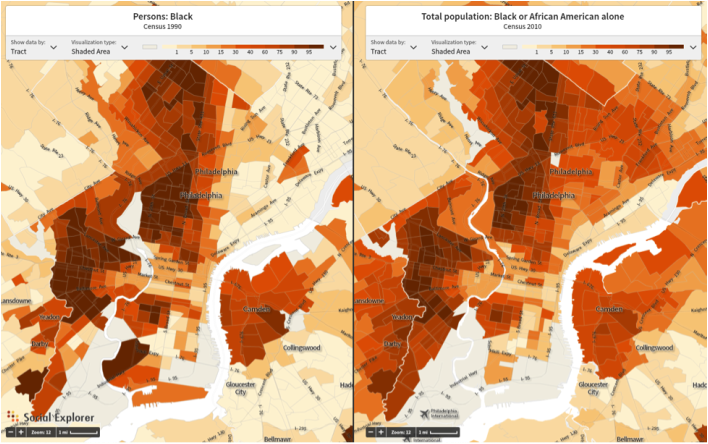
Figure 1: Black Demographic Change Between Census Tracts 1990-2010 [3]
Despite these racial demographic changes, Philadelphia remains one of the most unequal areas in the country alongside Baltimore, Columbus, Dallas, and Houston based on figures for household income, homeownership rate, housing values, and educational levels. The map in Figure 2 shows the how the income divide has become more stratified during the same period of racial dispersion between 1990 and 2010.
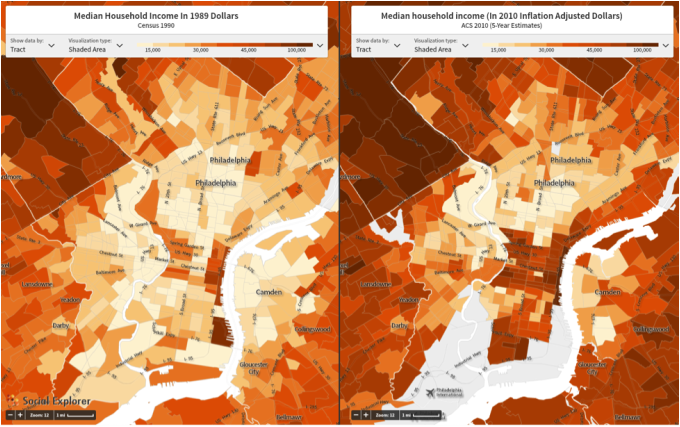
Figure 2: Income Stratification Between Census Tracts 1990-2010 [4]
During this wave of demographic change, the city also experienced a significant decline in its tree population. According to a study by American Forests, Philadelphia lost 1638 acres of tree cover between 1985 and 2001.[5] Unlike many other major cities in the United States, the majority of Philadelphia’s trees are publicly owned. This is due to the fact that over 50% of the city’s housing stock consists of row houses (highest percentage in the country), which offer minimal space for landscaping on private property.[6] During the period from 1985 to 2001, the tree population in Philadelphia declined so drastically due to the city’s failure to upkeep replanting trees that had died on public property.
In recent years, Philadelphia has been working towards building a more sustainable future. The city is currently leading the country in sustainable planning through their Greenworks Philadelphia report, which was released in 2009 and outlines the city’s target to become the greenest city in the United States. The plan dedicates a section towards improving tree coverage across the city, with a goal of increasing tree coverage by 30 percent in all neighborhoods from 2009 to 2025.[7] In 2010 Philadelphia launched a city-wide tree planting campaign and is partnering with local nonprofits to reach target numbers.
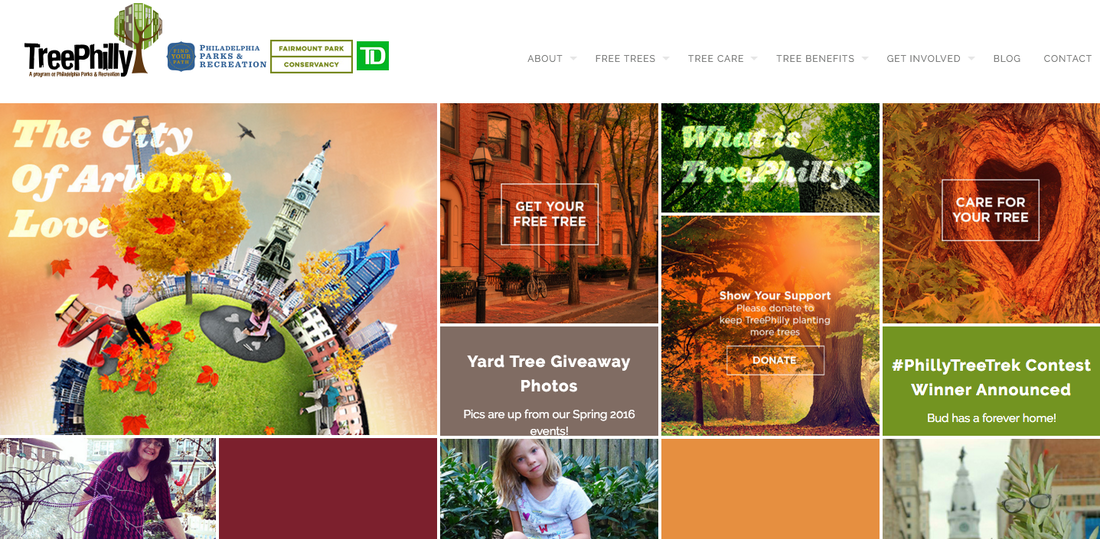
“Tree Philly” was launched as an organization in response to this plan and is one of the main sponsors for this project. They are partnered with Philadelphia Parks & Recreation and Fairmount Park Conservancy. Each spring and fall they organize a yard tree giveaway event, where they give out over 1,000 free trees. During the event they offer tree planting and care demonstrations and provide a free bag of mulch and educational materials. They provide free planting and delivery for individuals with limited mobility. However, one major limitation of this initiative is that these giveaway trees must be planted on private property. Thus, the recipients are responsible for the maintenance of the tree, a responsibility that can be quite costly. Ultimately, individuals of lower-income might not be able to afford the costs of watering a tree nor may they have the time to do so. Nonetheless, Tree Philly also allows property owners, including both residential and commercial properties, to request a street tree to be planted in front of their home or business. Renters must work with their landlords to make this request. In this way, these free trees are partisan to homeowners. Upon getting tree safety approval, their Street Tree Management Team selects an appropriate tree selection based on the location and they plant the tree within 6-18 months, depending on the season. It is unclear whether they Tree Philly has strategies for how to advertise to low-income neighborhoods. In general, their marketing techniques involve a stylish website and up-to-date posts on Instagram and Facebook. Their website seems to be less concerned with environmental justice and more focused on attracting a trendy, "hipster" population.
Now five years into the execution of the Philadelphia’s sustainability plan, this report seeks to look at current trends of demographic inequality throughout Philadelphia based on tree density.
In recent years, Philadelphia has been working towards building a more sustainable future. The city is currently leading the country in sustainable planning through their Greenworks Philadelphia report, which was released in 2009 and outlines the city’s target to become the greenest city in the United States. The plan dedicates a section towards improving tree coverage across the city, with a goal of increasing tree coverage by 30 percent in all neighborhoods from 2009 to 2025.[7] In 2010 Philadelphia launched a city-wide tree planting campaign and is partnering with local nonprofits to reach target numbers.
“Tree Philly” was launched as an organization in response to this plan and is one of the main sponsors for this project. They are partnered with Philadelphia Parks & Recreation and Fairmount Park Conservancy. Each spring and fall they organize a yard tree giveaway event, where they give out over 1,000 free trees. During the event they offer tree planting and care demonstrations and provide a free bag of mulch and educational materials. They provide free planting and delivery for individuals with limited mobility. However, one major limitation of this initiative is that these giveaway trees must be planted on private property. Thus, the recipients are responsible for the maintenance of the tree, a responsibility that can be quite costly. Ultimately, individuals of lower-income might not be able to afford the costs of watering a tree nor may they have the time to do so. Nonetheless, Tree Philly also allows property owners, including both residential and commercial properties, to request a street tree to be planted in front of their home or business. Renters must work with their landlords to make this request. In this way, these free trees are partisan to homeowners. Upon getting tree safety approval, their Street Tree Management Team selects an appropriate tree selection based on the location and they plant the tree within 6-18 months, depending on the season. It is unclear whether they Tree Philly has strategies for how to advertise to low-income neighborhoods. In general, their marketing techniques involve a stylish website and up-to-date posts on Instagram and Facebook. Their website seems to be less concerned with environmental justice and more focused on attracting a trendy, "hipster" population.
Now five years into the execution of the Philadelphia’s sustainability plan, this report seeks to look at current trends of demographic inequality throughout Philadelphia based on tree density.
QUANTITATIVE RESEARCH
In order to examine how tree plantings relate to the social and economic geography of Philadelphia, I conducted a multiple linear regression test between trees per acre at the census tract level and nine independent variables that I thought were relevant based on my literature review: white (Non-Hispanic) population percentage, black population percentage, percent less than high school degree (age 25+), percent with bachelor’s degree (age 25+), unemployment rate, vacancy rate, poverty rate, median household income, and median home values.
In order to create a normalized tree data with which to analyze this question, I utilized the point tree data that is available to the public on the Open Philly Tree Map and aggregated this information at the census tract level with the help of Professor Yesim Sungu-Eryilmaz and Bruce Boucek, one of our library consultants. Bruce was able to utilize GIS to compare this point tree data with a raster analysis of the green space in Philadelphia. I then utilized the ACS (American Community Survey) five-year estimates from 2010-2014 to gather data on my independent variables.
My hypothesis was that there would be a higher number of tree plantings and green space in areas of higher income, greater home values, larger percentage of white people, and larger percentage of bachelor’s degree. Conversely, I hypothesized that the number of tree plantings and urban green spaces would be lower in areas of lower income and home values, high poverty, vacancy and unemployment rates and higher percentages of African Americans and individuals with less than a high school degree.
Descriptive Statistics
As can be seen in Figure 3, within Philadelphia, the average percentage of white people is 42%, while the average percentage of African Americans is 44%.This confirms how Philadelphia is unique in having a larger black population versus white population. However, there are some census tracts that have 0% whites/blacks and some that have 100% blacks/whites, indicating some segregation. The average percentage of residents over the age of 25 with less than a high school degree is 12%, while the average percentage of residents over the age of 25 with a college degree is 10%. The average unemployment rate is 7% and the average poverty rate is 4%. On average 6% of the houses in a census tract are vacant. The average household income is $41,301. However, like with the question of race, the average covers a broad spectrum, with a minimum of $8,993 and a maximum of $128,669. Since the median ($36,818) is lower than the average, this indicates that the mean is skewed by higher incomes. Similarly, for the median home values, the median is far from the mean, indicating that the average home value is skewed in favor of higher values. In general, all of these descriptive statistics are skewed due to large variance between the maximums and minimums. This, therefore, further confirms the income stratification that is seen in Figure 2.
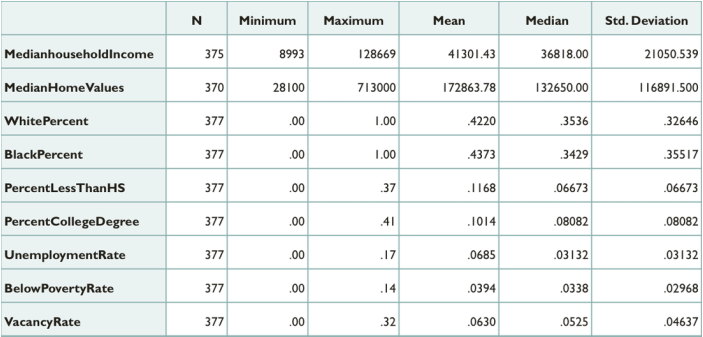
Figure 3: Descriptive Statistics
Multiple Linear Regression
Upon producing a correlation matrix for all of the variables, I found two cases of multicollinearity, meaning that one can be predicted linearly from the other with a substantial degree of accuracy. First, there was association (-.928) between the black population percentage and the white population percentage. Therefore, I decided to remove the black population percentage because by keeping the white population percentage, that means that anyone that is not included in this percentage would be a person of color. Second, there was association (.825) between the percentage of the population with a bachelor's degree and median home values. I concluded that it made more sense to remove the bachelor’s degree variable since we still have the less than high school degree variable. Thus, despite removing this variable I still have data that represents the impact of education in our model.
I then used multiple linear regression, a test that is used to explain the relationship between one continuous dependent variable and two or more independent variables. Upon conducting this test with my remaining seven independent variables, four of them demonstrated a significant relationship with trees per acre. I then created scatterplots to confirm that my variables were linear and discovered that the white population percentage was nonlinear and, thereby had to removed from my test model. This finding reflects the racial demographic changes that I discussed earlier. In Philadelphia, income, as opposed to race, has a stronger association with segregation.
Thus, upon revising my model, my final independent variables were median home values, median household income, and percent less than high school. Based on this final multiple linear regression model, median home values is the strongest indicator of inequality of trees between census tracts in Philadelphia because it has the largest standardized coefficient (.617). There is a positive relationship between median home values and tree density. Income and population percent less than high school do not have as strong of an influence on the regression model. Once median home values is controlled, there is a negative relationship between income and tree density and a negative relationship between percent less than high school education and tree density.
This model supported part of my original hypothesis in that there is a positive association between tree density and home values as well as higher educational levels. The multiple linear regression model surprisingly showed a negative partial slope for median income level. This would mean that as median household income decreases, the number of trees per acre increases. The original correlation output between median household income and tree density shows a weak positive association between the two variables. However, when controlled in the multiple linear regression model, the partial slope for median household income becomes negative. This negative partial slope may be a result of moderate correlation between the independent variables median household income and median home values. Based on my correlation matrix test, the collinearity between median household income and median home values is 0.759. However, I chose not to exclude either variable from my final model because the coefficient did not exceed the threshold of .8 to be categorized as highly correlated. In the end, the model had an R-Squared of 0.315, meaning that 32% of the variation in trees per acre is explained by these three variables. In the field of sociology, this is considered a substantial percentage.
Statistical Limitations
There were multiple limitations and other factors that influenced the outcome of this study. My original inquiry was to study the relationship between inequality and access to green space. Through this model, I hoped to include indicators of green space other than just trees such as the dispersion of parks and other grass spaces around Philadelphia. The data set I originally intended to use was a land cover data set that classified land area in Philadelphia based on seven classes: (1) tree canopy, (2) grass/shrub, (3) bare earth, (4) water, (5) buildings, (6) roads, and (7) other paved surfaces. This dataset, available through Philadelphia Open Source Data, was developed as part of the Urban Tree Canopy (UTC) Assessment for Philadelphia in 2008 and was reported as the most accurate and detailed land cover dataset for the area at the time of its release. Using this dataset, I would have been able to include tree canopy and grass/shrub acreage in our analysis between green space and inequality. Unfortunately, this land cover dataset was too complex to be reorganized by census tract for my project.
As a result, I resorted to using the Philly Tree Map dataset which is current data of tree locations in Philadelphia. This dataset is a crowd-sourced tree inventory using the Open Tree Map platform that utilizes datasets from local horticultural organizations in Philadelphia as well as additional user input. Because the Philly Tree Map dataset is open sourced, it may include bias based on the availability of resources from local organization and user input. In addition to tree location, the dataset includes input options for variables such as tree canopy, height, and trunk diameter. However, the majority of these additional variables are not recorded for most of the trees, which makes the data unusable.
Based on my findings in my literature review, the use of recent data may also be crucial in the outcome of my study. The data for the tree counts is based on current inventories as of 2016 and my demographic data is based on the most current ACS data from 2014. As discussed in the beginning of the report, Philadelphia launched a city-wide tree planting campaign in 2010 through their Greenworks Initiative, which has resulted in massive planting across the city within the past 6 years. These recent planting are inclusive in the dataset I used for analysis which may have resulted in a significantly different outcome than if we had used tree inventory prior to the city’s planting campaign. Furthermore, the tree planting campaign is only in progress so it is not clear where the city is prioritizing plantings over the course of the initiative, which may have also influenced my data and might explain why there is a negative association between trees per acre and median household incomes. Furthermore, demographic shifts in Philadelphia within the past two decades have made the city more integrated, particularly racially. These trends of integration made our model less reliable in predicting tree counts among certain populations. In future analysis I may opt to create a diversity index to use as an independent variable to measure inequality among race rather than individual race percentages.
BROKEN WINDOWS THEORY
“Prioritize Tree Planting in Low Canopy, High Crime Districts”--Greenworks Philadelphia
“People have an intuitive sense that trees are good things...“Trees are nice” isn’t a very useful statement. You need to know how nice and in what sorts of circumstances” ---Geoffrey Donovan “The Economics of Urban Trees”
There is actually fervid discord among scholars on whether trees can actually deter crime in neighborhoods. Some argue that trees can serve as a “natural hiding place for criminals” [8]. In fact, a case study of Washington D.C. in 2001 revealed “offenders often target areas near dense vegetation because it can ‘reduce effort and risk by offering concealment.’” [ibid]
On the other hand, scholars in favor of the Broken Window Theory contend that trees can serve as a form of placemaking to engage the public and indicate that a community cares about its neighborhood, thereby, discouraging crime. As counter-evidence to the previous argument, another study in 2001 on public housing in Chicago found that “‘the greener a building’s surrounding were, the fewer crimes reported’” [ibid]. A case study of Baltimore, however, shed more light on this relationship between trees and crime. They discovered that the level of grooming can influence whether the association between crime rates and trees was positive or negative; trees that were low and poorly groomed appeared to have a correlation with higher crime rates, while taller broad canopies seemed to have a correlation with lower crime rates. Thus, in terms of understanding how trees relate to the urban environment, we must look at more than just the number of trees planting. Each type of tree has its own form of symbolism.
Beyond having the potential to discourage crime, the planting of trees can also bring communities together. Within Tree Philly, for example, they have a Treekeepers work development program that “is committed to supporting ex-offenders in securing meaningful work and successfully re-entering the community” [9]. This exemplifies how a “green” project for a city can actually be sustainable by promoting community engagement.
CONCLUSION
While the Greenworks Initiative has been praised for “linking environmental justice to their sustainability plan,” this plan is more than a public goods work. It is undeniable that this project commodifies trees by using them as a way to recreate a new hip city image, as evidenced by Tree Philly's use of social media.
“One of the things that tends to happen with rankings is that we conflate sustainability with hipsterism” --Mark Alan Hughes, professor at U. Penn., “Is Philly the Greenest City in America?”
In this way, trees as a commodity and investment correlate not only to income, but also to those who have a vested interest in the land via tree planting. The City may actually have an interest in environmental justice, but this initiative is also an effort to revitalize the city center and pull people in again. Ultimately, seemingly objective urban attributes like trees are illustrative of how segregation and unequal distribution of resources works.
Ten years out it would be interesting to compare tree densities prior to 2010 and after 2025 (target date for 30% increase in tree plantings per neighborhood) to explore if estimating tree density based on inequity becomes less predictable. If they are successful in accomplishing this goal, Philadelphia would serve as a good model for how other cities can also promote the right to green spaces. Beyond Philadelphia, this study will contribute to the developing research that explores socio-spacial inequity based on the dispersion of trees. Moving forward, cities may want to use tree plantings as a tool to foster equitable development.
Ten years out it would be interesting to compare tree densities prior to 2010 and after 2025 (target date for 30% increase in tree plantings per neighborhood) to explore if estimating tree density based on inequity becomes less predictable. If they are successful in accomplishing this goal, Philadelphia would serve as a good model for how other cities can also promote the right to green spaces. Beyond Philadelphia, this study will contribute to the developing research that explores socio-spacial inequity based on the dispersion of trees. Moving forward, cities may want to use tree plantings as a tool to foster equitable development.
SPECIAL THANKS
- Professor Yesim Sungu-Eryilmaz
- Bruce Boucek
- Melissa Isidor
REFERENCES
[1] https://www.michigan.gov/documents/dnr/22_benefits_208084_7.pdf.
[2]http://www.pewtrusts.org/~/media/legacy/uploadedfiles/wwwpewtrustsorg/reports/philadelphia_research_initiative/philadelphiapopulationethnicchangespdf.pdf.
[3] http://www.socialexplorer.com/b898433026/view and http://www.socialexplorer.com/b5e81cc2ad/view.
[4] http://www.socialexplorer.com/7fcae5ac5b/view and http://www.socialexplorer.com/60211071ea/view.
[5] http://www.phila.gov/green/greenworks/pdf/Greenworks_OnlinePDF_FINAL.pdf.
[6]https://www.washingtonpost.com/news/wonk/wp/2015/09/21/the-most-popular-type-of-home-in-every-major-american-city-charted/.
[7]http://www.phila.gov/green/greenworks/pdf/Greenworks_OnlinePDF_FINAL.pdf.
[8] http://www.citylab.com/crime/2012/05/can-trees-actually-deter-crime/2107/.
[9] http://treephilly.org/tree-care/tree-keepers/.
